Live strategy status
See at a glance whether each configured strategy is active, paused by a risk rule, or waiting for a signal. Timestamps show the last received signal and the last executed order for every pipeline.

Monitoring Dashboard
The Highland Society monitoring dashboard shows you live positions, risk utilisation, system health, and P&L in a single slate-professional view — colour-coded to surface problems before they compound.
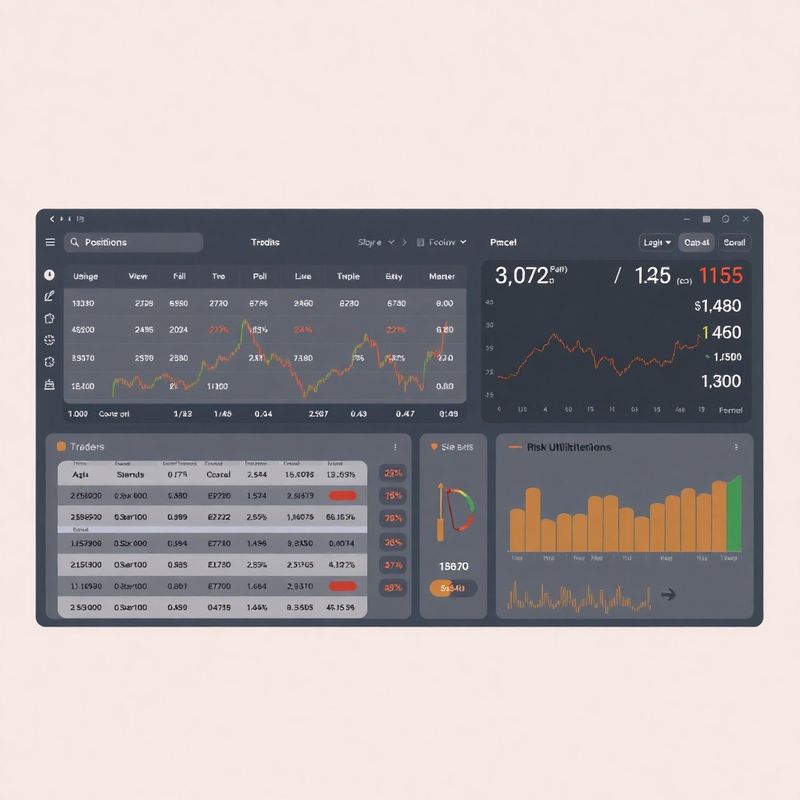
The monitoring dashboard is the single operational screen for everything running on your Highland Society account. The left panel shows active strategies, their current state (running, paused, in risk-halt), and a real-time count of signals received and orders executed in the current session. The centre panel displays your live positions across all connected brokers — instrument, direction, entry price, current P&L in both percentage and RON/EUR value, and time in trade. The right panel is your risk utilisation gauge: how close you are to each configured limit expressed as a percentage of the threshold. Colour coding follows a consistent traffic-light system: green below 70% of any limit, amber between 70–90%, red above 90% with an audio-optional alert. The dashboard is accessible via browser on desktop and mobile; there is no native app at this time.
Each panel is independently configurable; hide what you don't need, expand what matters most to your workflow.
See at a glance whether each configured strategy is active, paused by a risk rule, or waiting for a signal. Timestamps show the last received signal and the last executed order for every pipeline.
All open positions across connected brokers in one table, refreshed every 10 seconds. Sort by P&L, instrument, or time in trade. Click any row to expand full order details and fill history.
A chronological feed of risk events — rule triggers, limit approaches, kill-switch activations, and reconciliation discrepancies. Each entry links to the relevant strategy and the rule that fired.
“I've used four different trading platforms over the past three years and the Highland Society dashboard is the first one where I actually know what's happening without clicking through five sub-menus. The risk utilisation panel changed how I think about my limits — seeing 87% in amber made me tighten my position cap two weeks before a volatility spike that would have hit me hard.”
— Cristina Văduva, multi-strategy trader, Brașov
Book a demo and we'll walk you through a real account running a live strategy — no staged screenshots.